Customer feedback is a crucial source of information describing user experience with a company and its service. Just like in product development, efficient use of feedback can help identify and prioritize opportunities for company’s further development.
Thanks to internet, today we have an access to numerous sources where people willingly share their experience with different companies and services. Why not use this opportunity to extract some valuable information and derive some actionable-insights to deliver best customer experience?

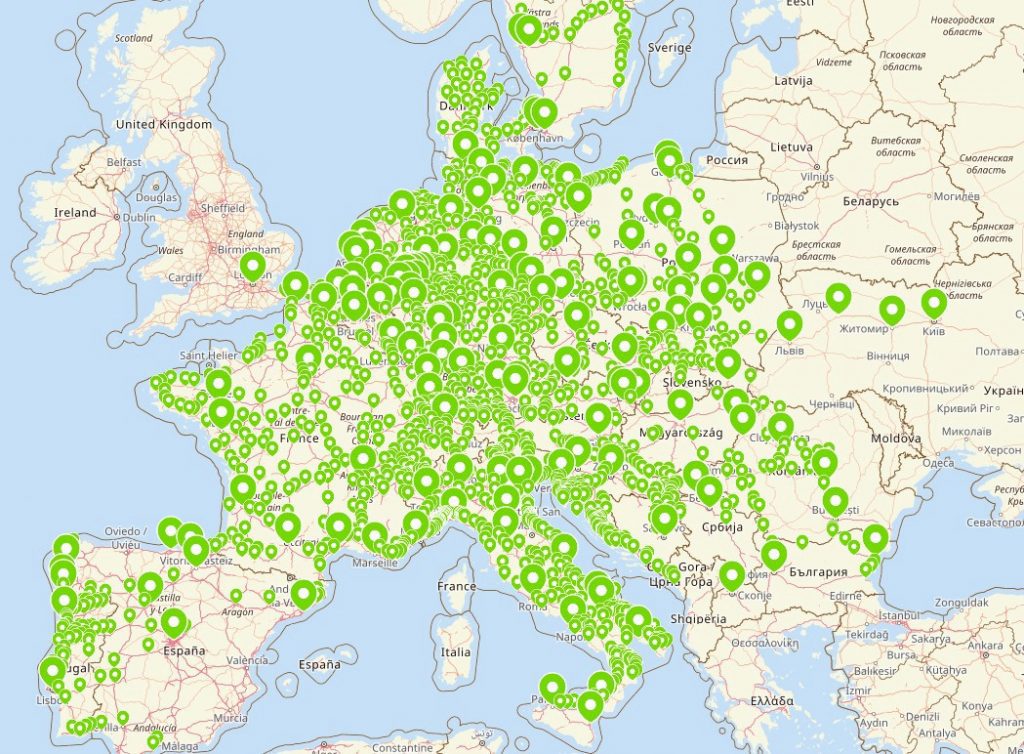
I work as a Product Owner of Data Science Incubation team at Flixbus, a major European e-mobility company providing intercity bus services across Europe. Flixbus network offers 120,000+ daily connections to over 1,700 destinations in 28 countries and since recently expanded its operations to the U.S. market.

While the company already has an established process of collecting customer feedback, I decided to check what the world wide web has to offer in addition to that. This is how I came across Trustpilot.com a review platform where users can share their experience with virtually any company in the world. To my surprise, I found out that there are over 2,000 customer reviews of Flixbus.com posted in the last couple of years. And the number keeps growing by day.

Each review contains: a rating on 1–5 scale indicating overall customer satisfaction with the service, date when a review was published, useful reviewer info (e.g. country location) and a free-form text review itself with a header. While rating indicates an overall customer sentiment, it is the reviews that contain highly valuable information describing major pain points of customers’ experience.
By scraping all those reviews we can collect a decent amount of quantitative and qualitative data, analyze it and identify areas for improvement. Thankfully, python provides libraries to easily deal with those tasks.
Scraping the reviews
For web scraping I decided to go with BeautifulSoup library, which does the job and very simple to use. If you have no prior experience scraping the web, but you would like to try doing it yourself, I would highly recommend reading this great post: “Web Scraping with Python and BeautifulSoup”.

Alright… So after studying the structure of Trustpilot web-site, I came up with a list of possible data points to collect:
- Reviewer’s Name
- Review Header
- Review Body
- Date
- Reviewer’s Country Location
Though it might seem to be a limited list of data, it is sufficient to perform an insightful data analysis, which will follow.
As a first step, I would like to share a custom function for scraping all reviews from a specified company’s review page on Trustpilot.com :
def clean_string(column):
    return column.apply(lambda x: x.replace("\n",'',2)).apply(lambda x: x.replace('  ',''))

def scrape_reviews(PATH, n_pages, sleep_time = 0.3):


    names = []
    ratings = []
    headers = []
    reviews = []
    dates = []
    locations = []

    for p in range(n_pages):

        sleep(sleep_time)

        http = requests.get(f'{PATH}{p}')
        bsoup = BeautifulSoup(http.text, 'html.parser')

        review_containers = bsoup.find_all('div', class_ = 'review-info__body')
        user_containers = bsoup.find_all('div', class_ = 'consumer-info__details')
        rating_container = bsoup.find_all('div',class_ = "review-info__header__verified")
        date_container = bsoup.find_all('div',class_ = "header__verified__date")


        for x in range(len(data_containers)):

            review_c = review_containers[x]
            headers.append(review_c.h2.a.text)
            reviews.append(review_c.p.text)
            reviewer = user_containers[x]
            names.append(reviewer.h3.text)
            rating = rating_container[x]
            ratings.append(rating.div.attrs['class'][1][12])
            date = date_container[x]
            dates.append(datetime.datetime.strptime(date.time.attrs['datetime'][0:10], '%Y-%m-%d').date())


            prof = profile_link_containers[x]
            link = 'https://www.trustpilot.com'+ prof.a['href']
            c_profile = requests.get(f'{link}')
            csoup = BeautifulSoup(c_profile.text, 'html.parser')
            cust_container = csoup.find('div', class_ = 'user-summary-location')
            locations.append(cust_container.text)

    rev_df = pd.DataFrame(list(zip(headers, reviews, ratings, names, locations, dates)),
                  columns = ['Header','Review','Rating', 'Name', 'Location', 'Date'])

    rev_df.Review = clean_string(rev_df.Review)
    rev_df.Name = clean_string(rev_df.Name)
    rev_df.Location = clean_string(rev_df.Location)
    rev_df.Location = rev_df.Location.apply(lambda x: x.split(',',1)[-1])
    rev_df.Rating = rev_df.Rating.astype('int')
    rev_df.Date = pd.to_datetime(df.Date)

    return rev_df
You can simply copy paste and use this function to scrape reviews for any other company on the same review platform. All you need to do is to specify a link (link to a page number, where page number will be replaced by variable p), number of review pages to loop through and you could change sleep time (included just in case, to avoid throttling).
df = scrape_reviews(PATH = 'https://www.trustpilot.com/review/flixbus.com?languages=all&page=',
                   n_pages = 80)
Running the scraping function gives us the following data frame:

As a result, we have 2,080 comments from 100 different countries! Isn’t that awesome? 🙂
Data Analysis
With this information at hand, we can start off with a quantitative analysis. For general understanding, let’s see the rating distribution for Flixbus.com:

Well, seems like we have 2 extremes, very happy customers and customers who, unfortunately, experienced some issues with our service. However, it is still great to see that positive reviews exceed the negative ones.
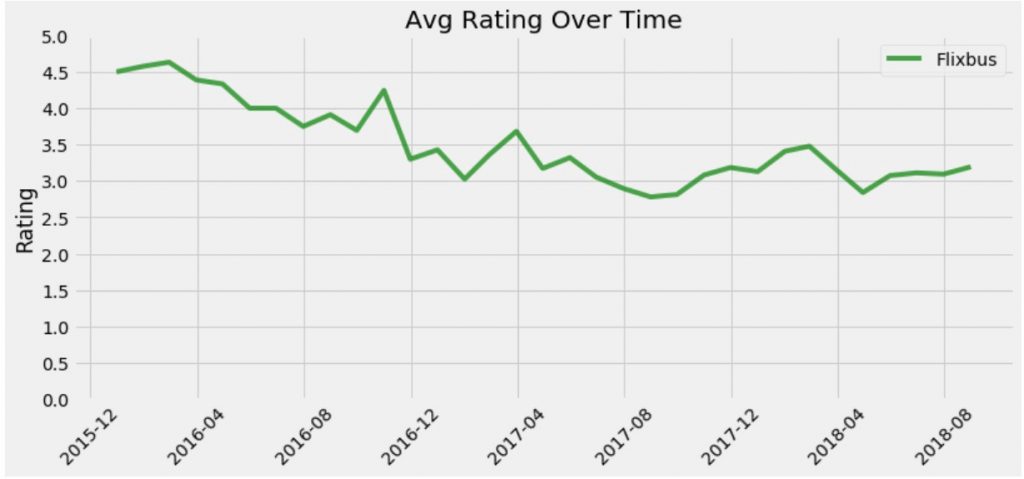
Additionally, we can see how the average monthly rating has been developing over time:

Despite of a good start at the end of 2015, the average rating was declining over the next 2 years to reach the all time low at around 2.8 in September 2017. Since then the rating was trending in a sideways channel and currently stands at the average rating of 3.2.

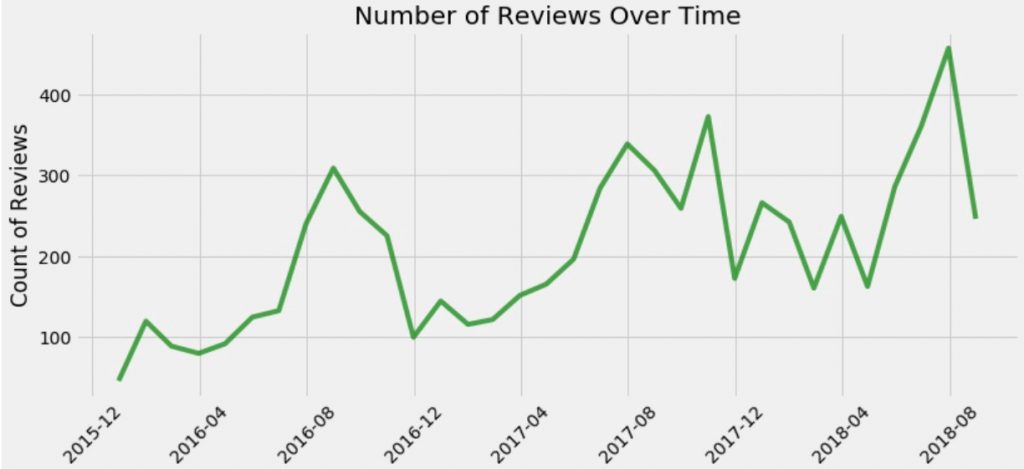
In terms of number of reviews per month, we see an increasing trend with clear seasonality pattern. We observe local peaks around August and September of each year, which is most probably linked to the high season of bus travels.
Given that we also scraped country location of each reviewer, we can visualize this information to see where the most of the comments come from.

Since Flixbus is a German based company, no surprise that Germany is at the top of the list followed by the U.K., Italy, Denmark and France.
Moving forward, let’s focus on top 10 countries by the amount of reviews representing 70% of all data.
Splitting the reviews by Year, we see that most of the reviews were generated in 2017, with the largest portion coming from Germany. In 2018 the numbers keep growing with similar paste, however, now the U.K. is in the lead by the amount of posted reviews.

To get a better understanding of overall sentiment per country, let’s have a look at the share of ratings:

As seen on the chart above, Italy, U.S. and Czech Republic have the largest share of positive reviews with 5 stars rating, followed by Germany, France and Belgium. On the contrary, Denmark stands out with the largest share of 1 star rating.
Now, to understand what the reviews are about, we will apply some basic NLP.
Natural Language Processing
Previously, we identified Denmark as a country with some of the most negative reviews. Hence, before looking at all countries together let’s try to understand what is happening in Denmark specifically.
As a very first step, we have to translate reviews from Danish into English using googletrans library for python. Working on this task I focused on 1 star reviews only, accounting for 93 comments in total, to identify the major pain points mentioned by our customers from this country.
Once the translation is finished, with the help of nltk library we can tokenize the text, remove stop words and lemmatize them to avoid unnecessary inconsistency. As a final step we count the words and plot 30 most frequently mentioned ones using nltk’s Frequency distribution plot.
As you can see we have a lot of words that don’t really point out specific problems. Naturally, most often we see our customers mentioning “bus” and the company name. However, we can also spot a frequent use of words such as ticket, time, service, driver, money etc. that could partially indicate the problem, but still there is no clarity about the issues.

To get more context, we can proceed using bi-grams, which provide the following result:

With bi-grams we get a much clearer context and can easily identify general problems that include: customer service, money back (or refund), delays, bus stops, issues with bus drivers and air conditioning in the bus. Hence, in just a few seconds we can summarize the main issues mentioned by customers in 93 reviews!
Now let’s use the same approach for all 10 countries and reviews with 1 star rating.

You will notice that the results are not considerably different from what we saw in the previous chart, however, the ranking of bi-grams has changed slightly. A person with domain knowledge would immediately identify a number of customer experience aspects, including:
- Customer service
- Bus driver
- Refund (money back)
- Delays (late arrival and/or departure)
With this result, we now have identified 4 major areas for further deep dives to discover opportunities for improving customer experience and satisfaction with our service.
On the other hand, we can do the same analysis for 5 star rating reviews to understand what the customers enjoy the most about our service.

Looking at the chart above, it is great to see that many reviewers specifically point out:
- The cleanliness and comfort of our buses
- Find it very easy to book tickets with our platform
- Appreciate the value for money
- Willing to recommend our services to others
Conclusion
The approach described above is very simple and far from its full potential. However, it manages to deliver some valuable insights, helps to understand customer issues and derive major pain points in a matter of minutes provided there are thousands of comments in various languages.
Hope this was useful for you and you can apply some knowledge shared here for your own work!
