In this tutorial we’ll walk through a simple convolutional neural network to classify the images in CIFAR10 using PyTorch.
We’ll also set up Weights & Biases to log models metrics, inspect performance and share findings about the best architecture for the network. In this example we’re using Google Colab as a convenient hosted environment, but you can run your own training scripts from anywhere and visualize metrics with W&B’s experiment tracking tool.
Getting Started
- Open this Colab notebook.
- Click “Open in playground” to create a copy of this notebook for yourself.
- Save a copy in Google Drive for yourself.
- Step through each section below, pressing play on the code blocks to run the cells.
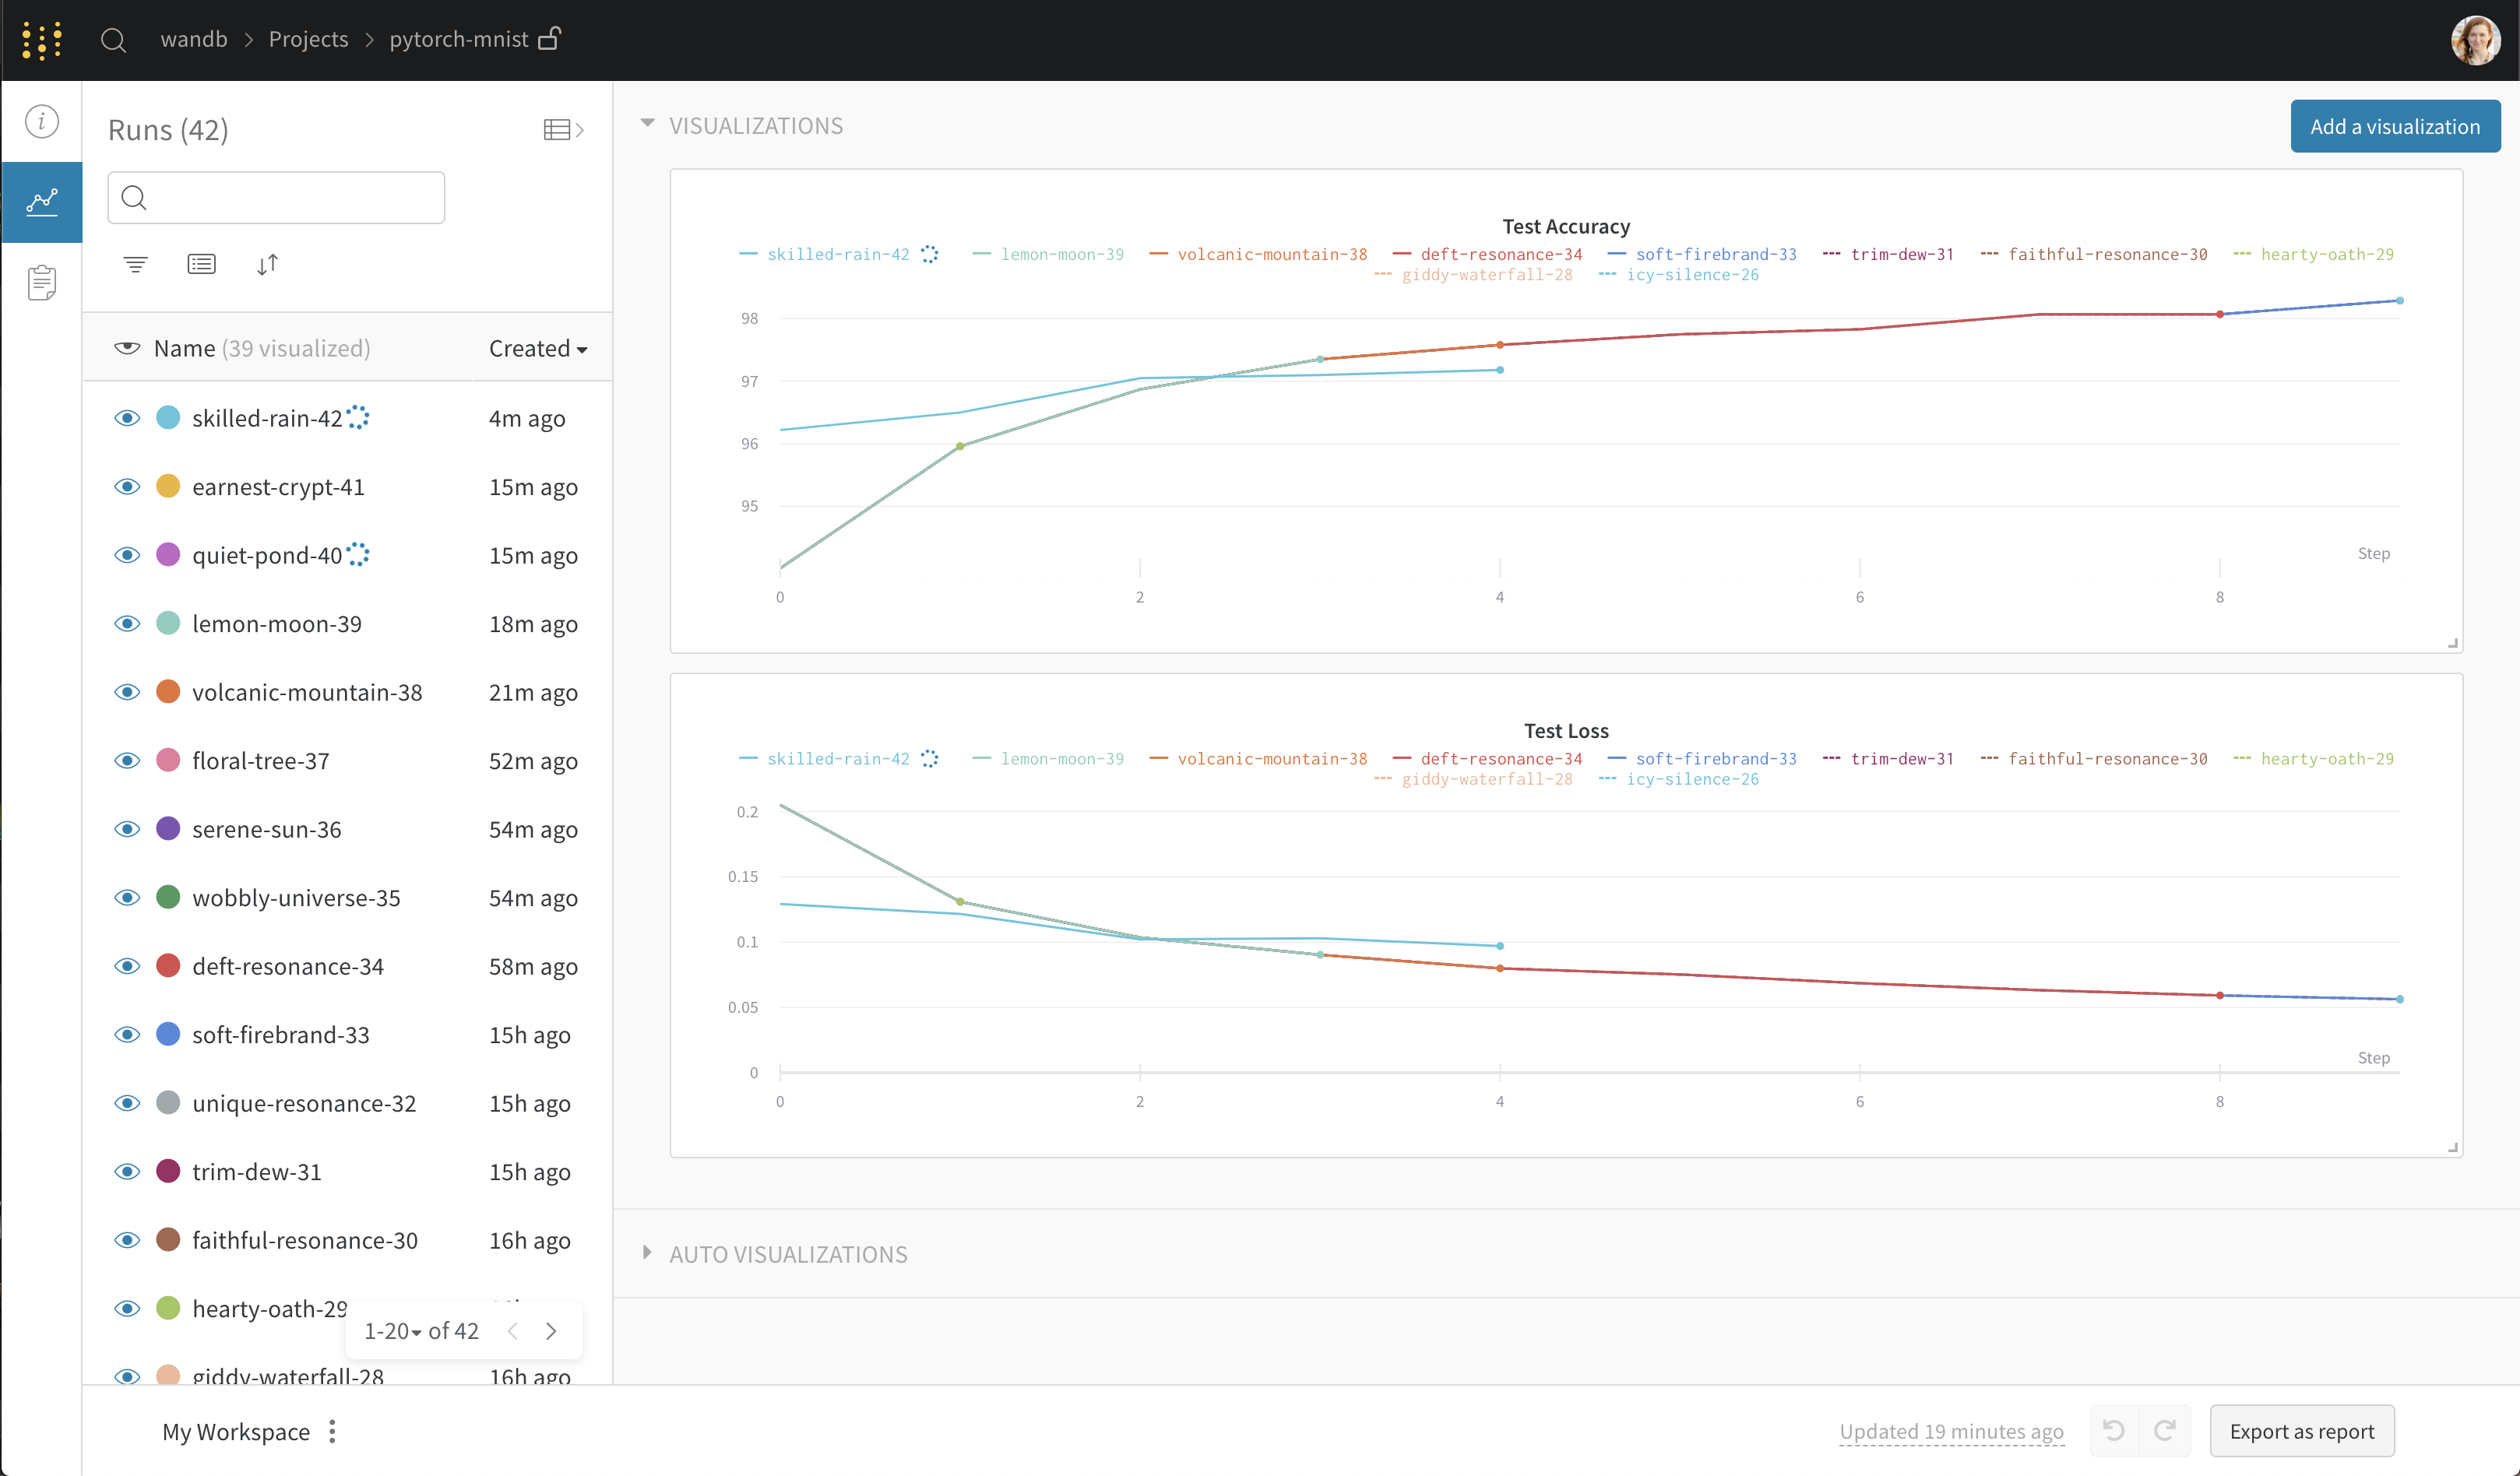
Results will be logged to a shared W&B project page.
Training Your Model
Let’s review the key wandb commands we used in the Colab notebook above.
Setup
- pip install wandb – Installs the W&B library
- import wandb – Imports the wandb library
- wandb login – Login to your W&B account so you can log all your metrics in one place
- wandb.init() – Initializes a new W&B run. Each run is single execution of the training script.
Initialize Hyperparameters
- wandb.config – Saves all your hyperparameters in a config object. This lets you use our app to sort and compare your runs by hyperparameter values.
We encourage you to tweak these and run this cell again to see if you can achieve improved model performance!
Track Results
- wandb.watch() – Fetches all layer dimensions, gradients, model parameters and log them automatically to your dashboard.
- wandb.save() – Saves the model checkpoint.
Visualizing Results
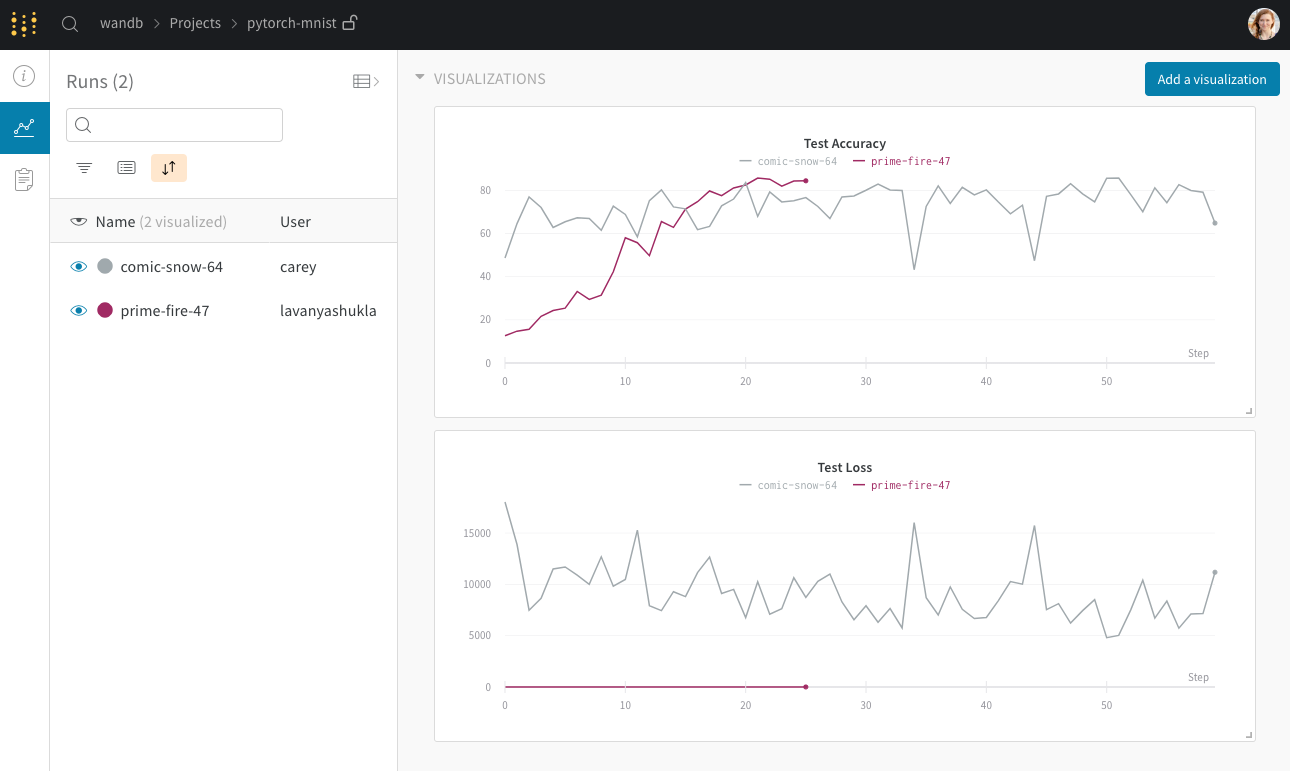
One you’ve trained your model you can visualize the predictions made by your model, its training and loss, gradients, best hyper-parameters and review associated code.
To view runs created by people in this public project:
- Check out the project page.
- Press ‘option+space’ to expand the runs table, comparing all the results from everyone who has tried this script.
- Click on the name of a run to dive in deeper to that single run on its own run page.
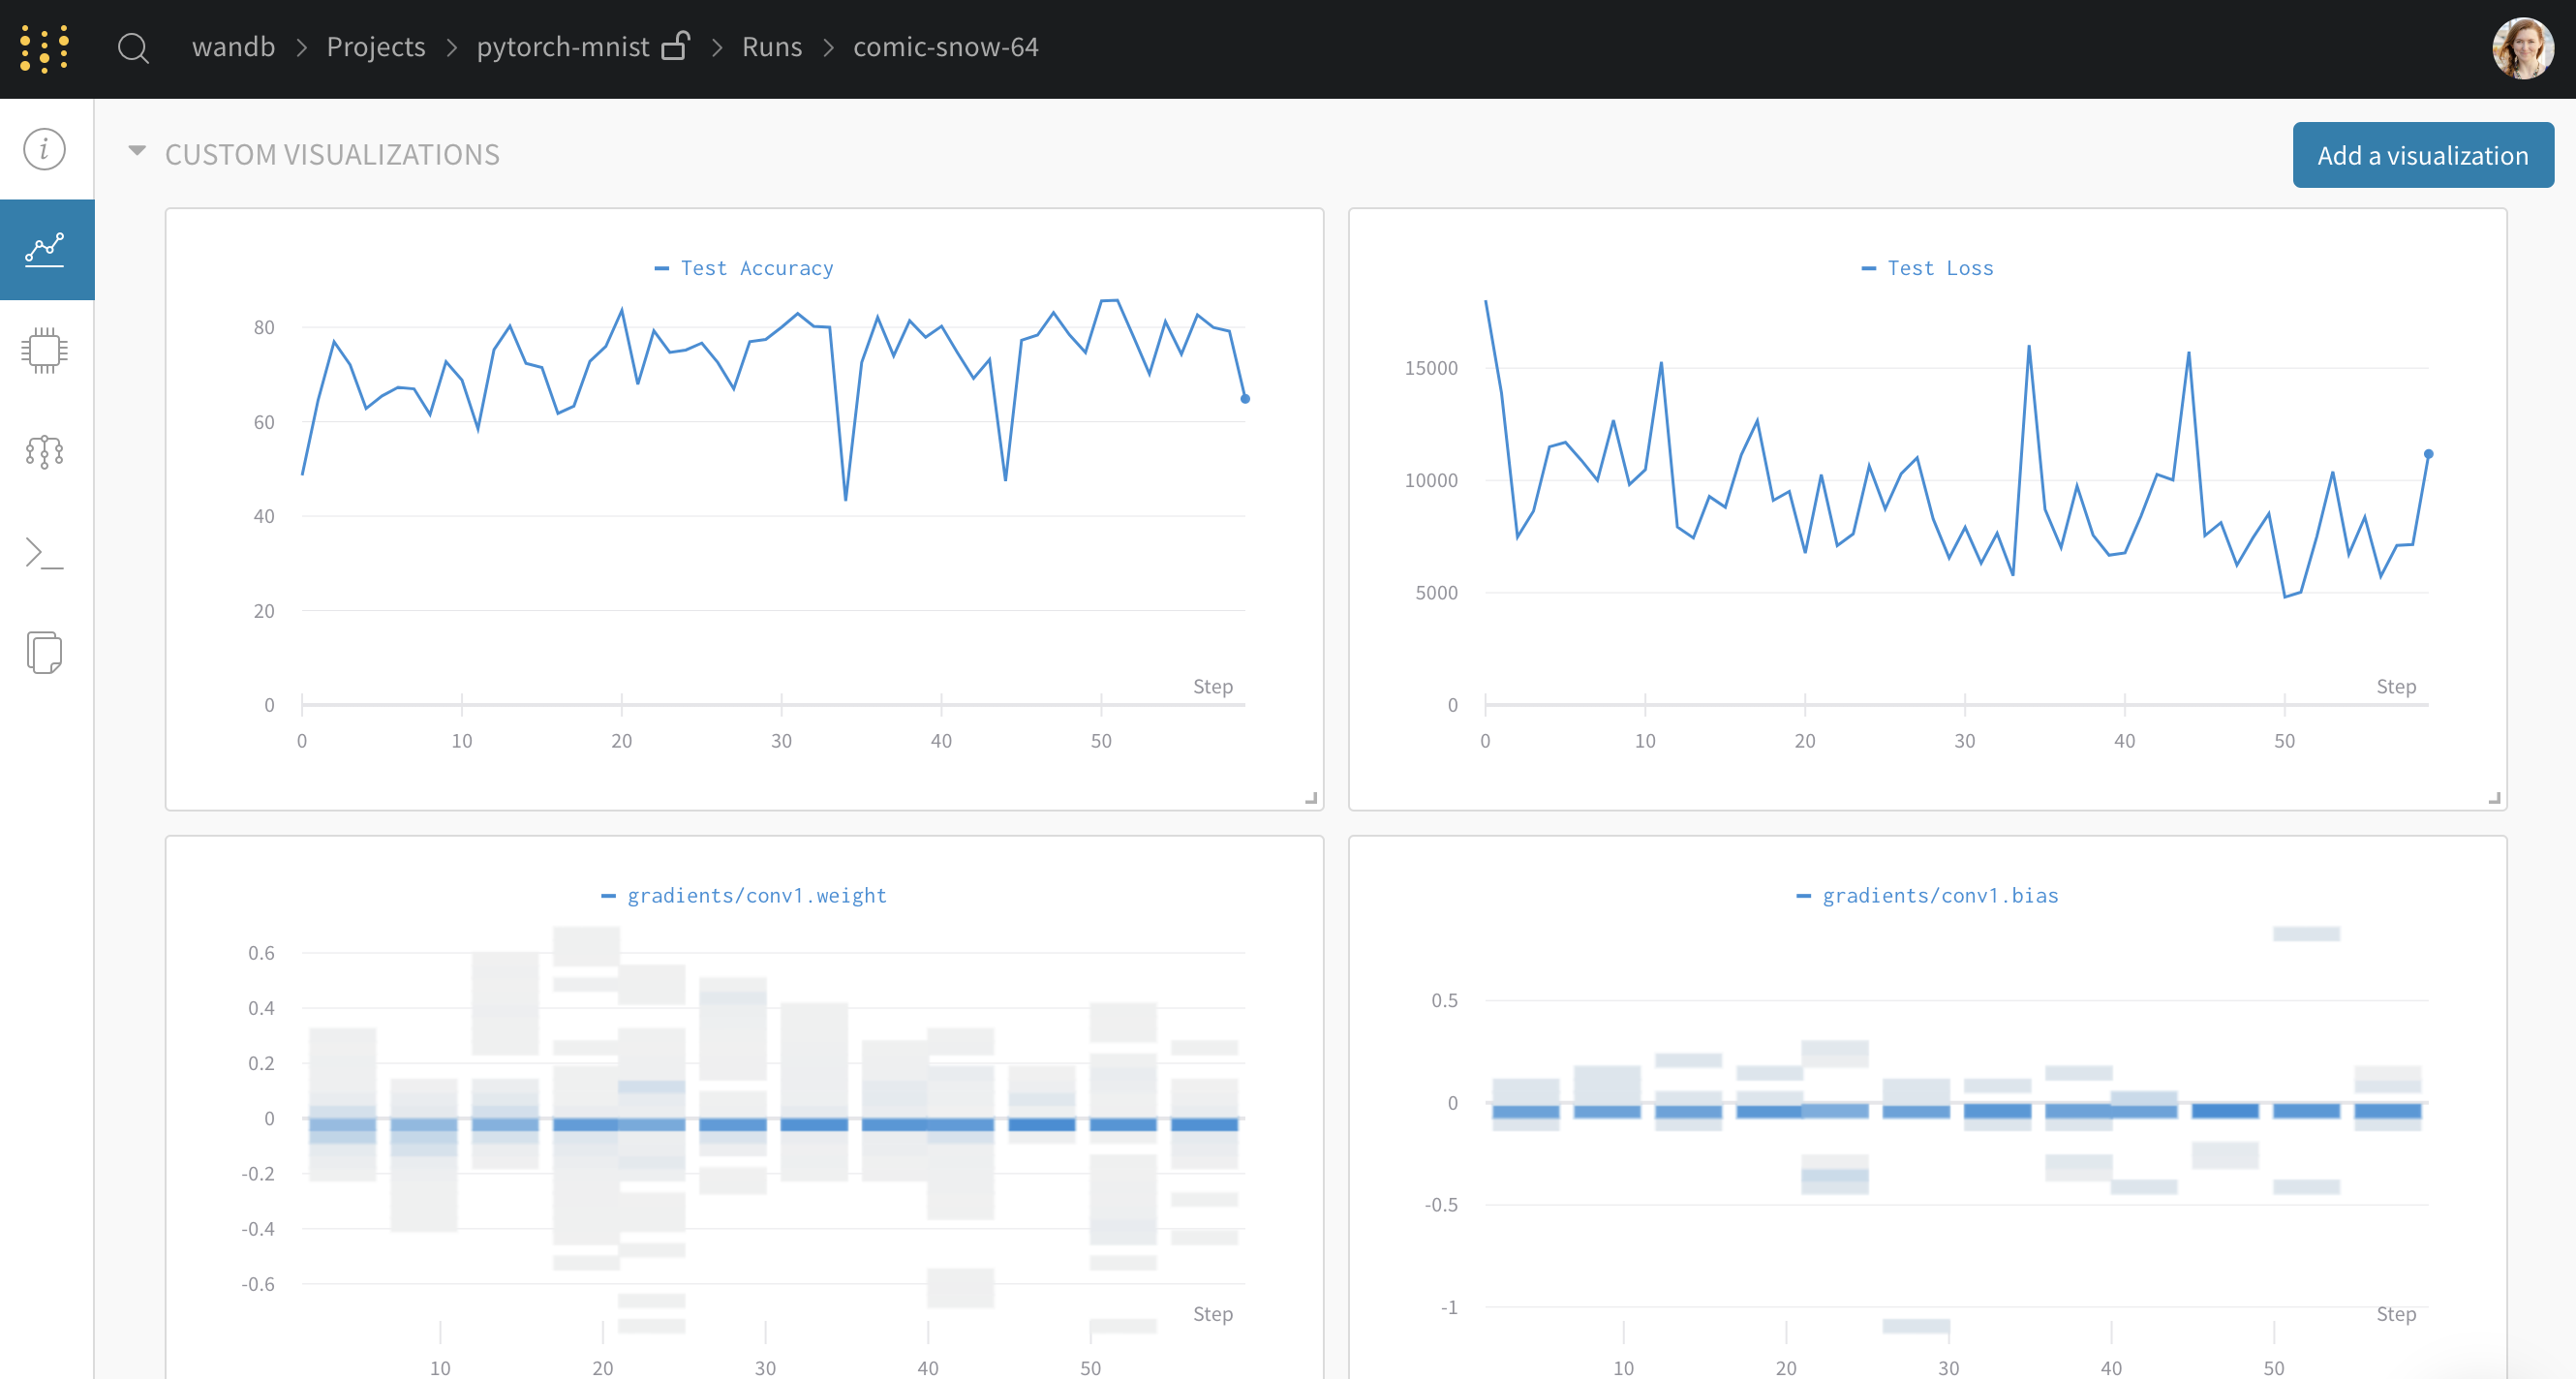
Visualize Gradients
Click through to a single run to see more details about that run. For example, on this run page you can see the gradients I logged when I ran this script.
Visualize Predictions
You can visualize predictions made at every step by clicking on the Media tab. Here we can see an example of true labels and predictions made by our model on the CIFAR dataset.

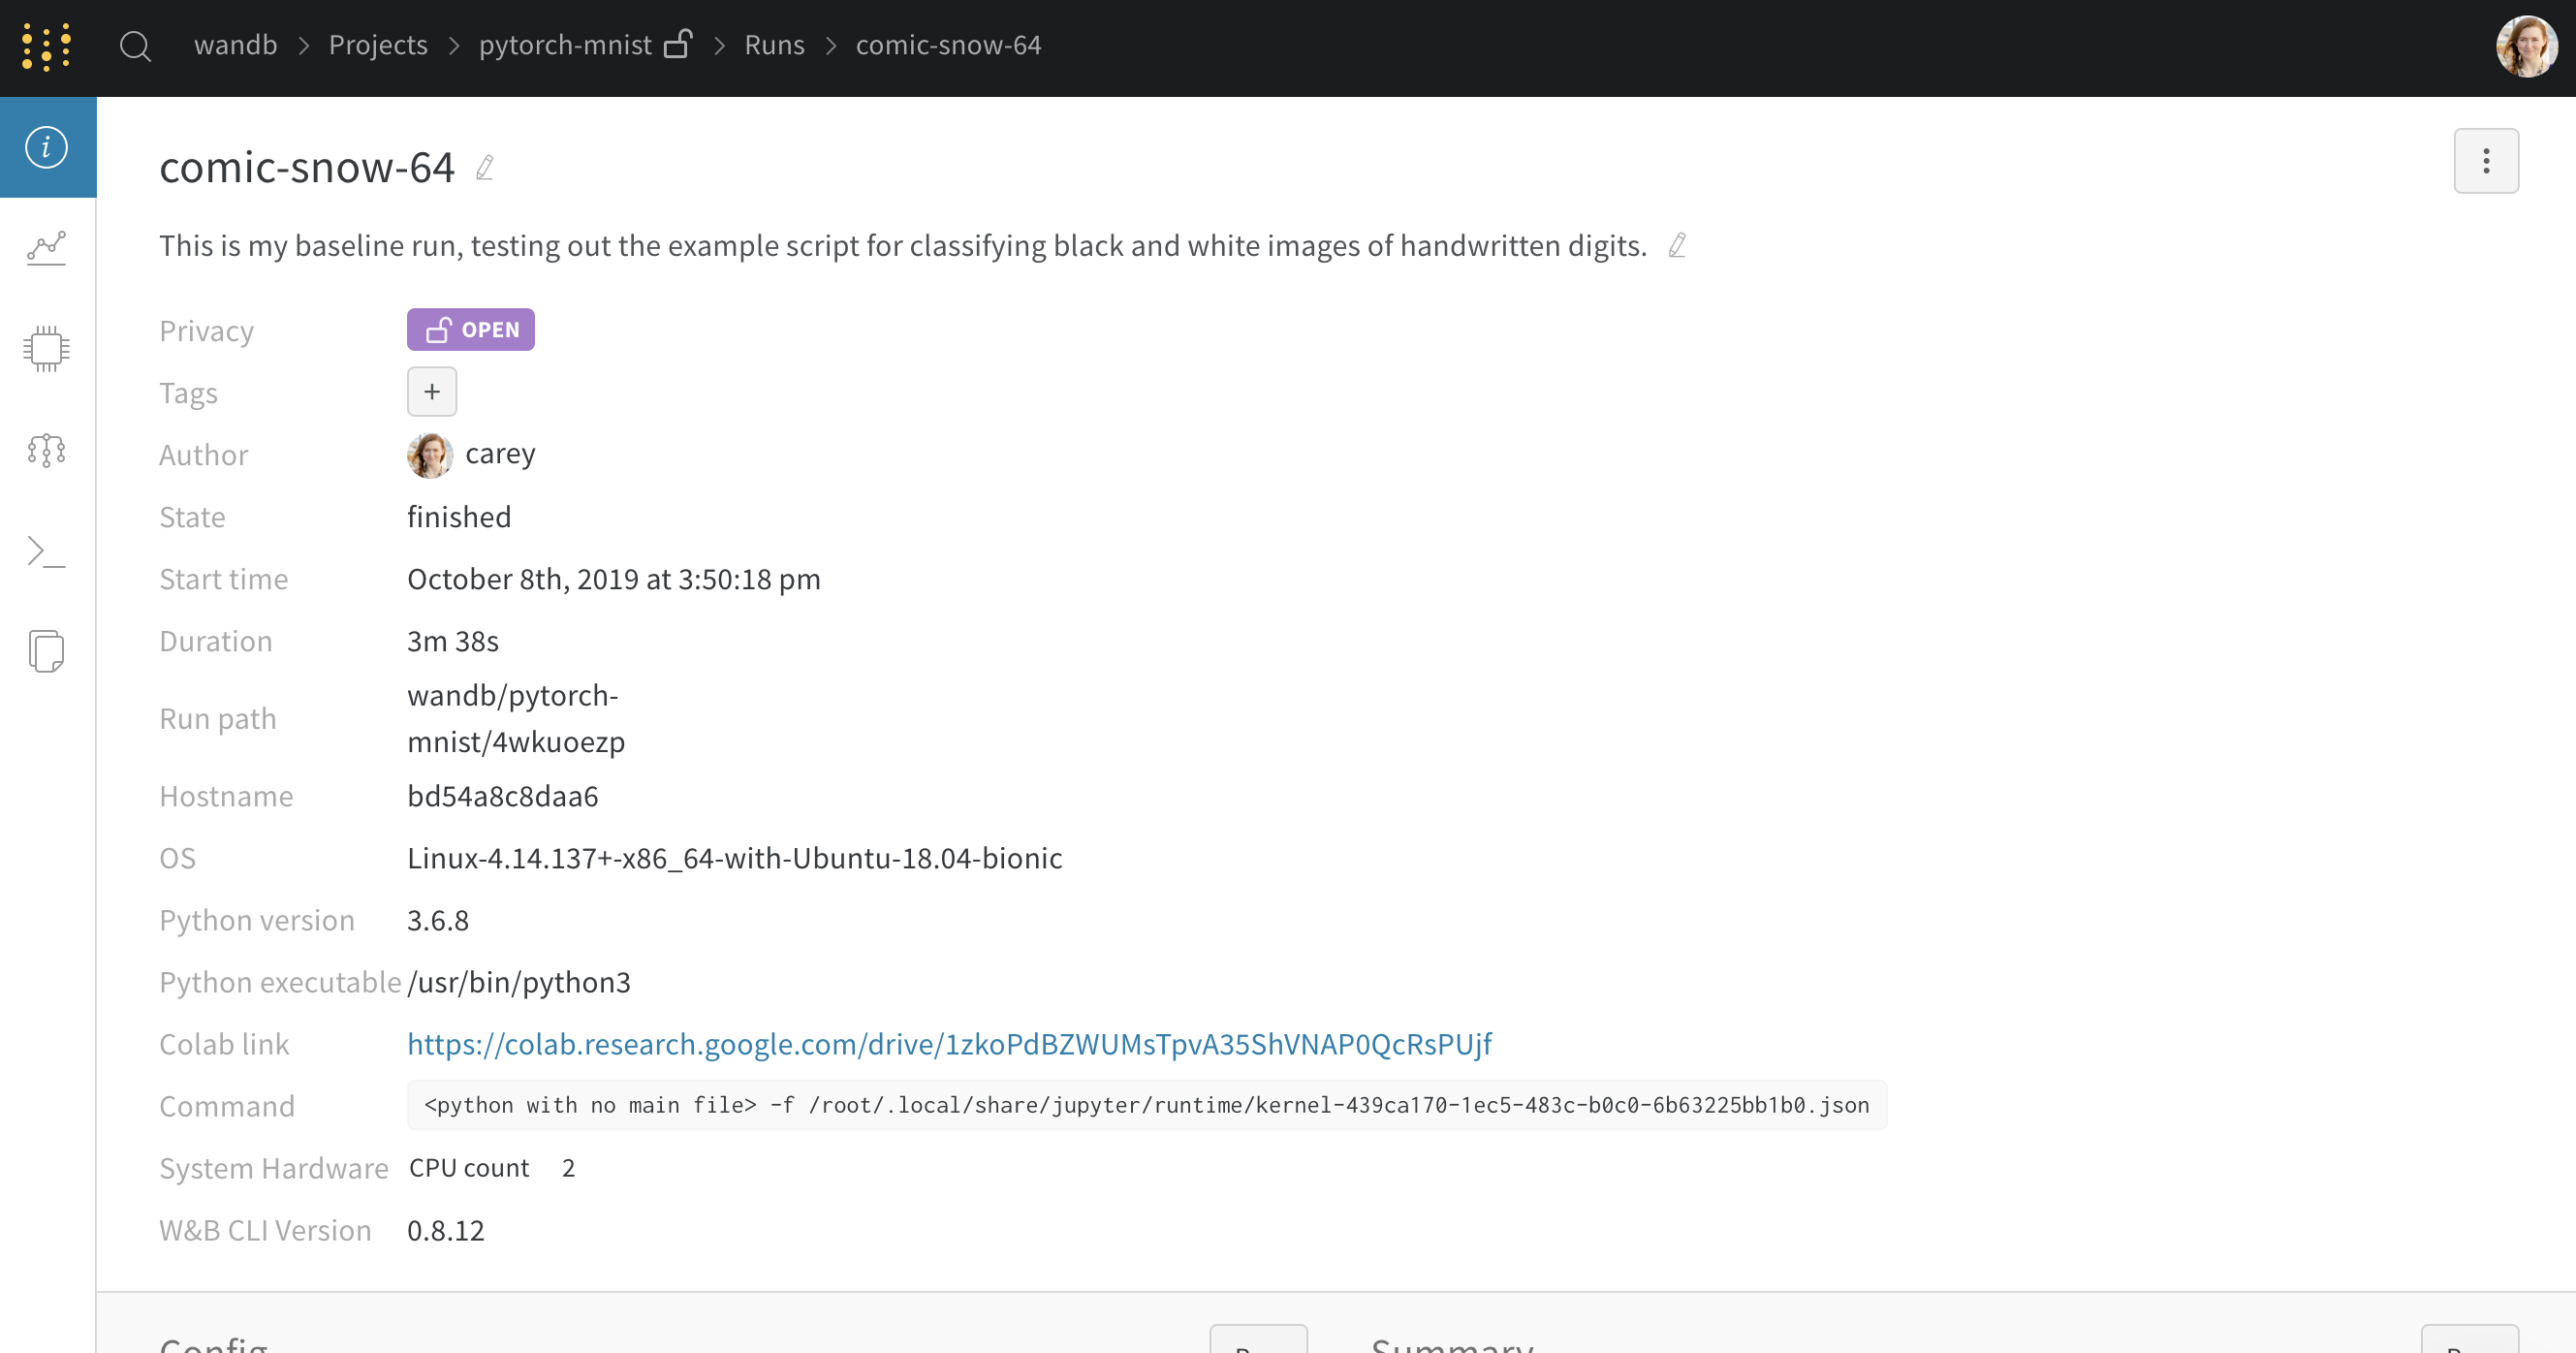
Review Code
The overview tab picks up a link to the code. In this case, it’s a link to the Google Colab. If you’re running a script from a git repo, we’ll pick up the SHA of the latest git commit and give you a link to that version of the code in your own GitHub repo.
Visualize Relationships
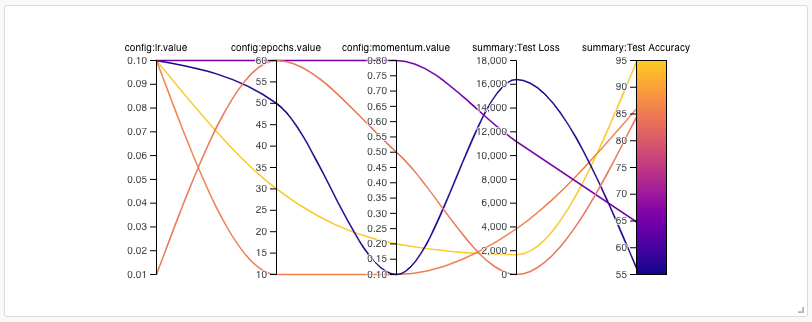
Use a parallel coordinates chart to see the relationship between hyperparameters and output metrics. Here, I’m looking at how the learning rate and other metrics I saved in “config” affect my loss and accuracy.
Next Steps
We encourage you to fork this colab notebook, tweak some hyperparameters and see if you can beat the leading model! Your goal is to maximize Test Accuracy. Good luck!
More about Weights & Biases
We’re always free for academics and open source projects. Email [email protected] with any questions or feature suggestions. Here are some more resources:
- Documentation – Python docs
- Gallery – example reports in W&B
- Articles – blog posts and tutorials
- Community – join our Slack community forum
